#BTCBackAbove80K Bitcoin Reclaims $80,000
Bitcoin has officially reclaimed the major $80,000 psychological level in May 2026, marking one of the most important structural recoveries since the correction from the October 2025 all-time high above $126,000.
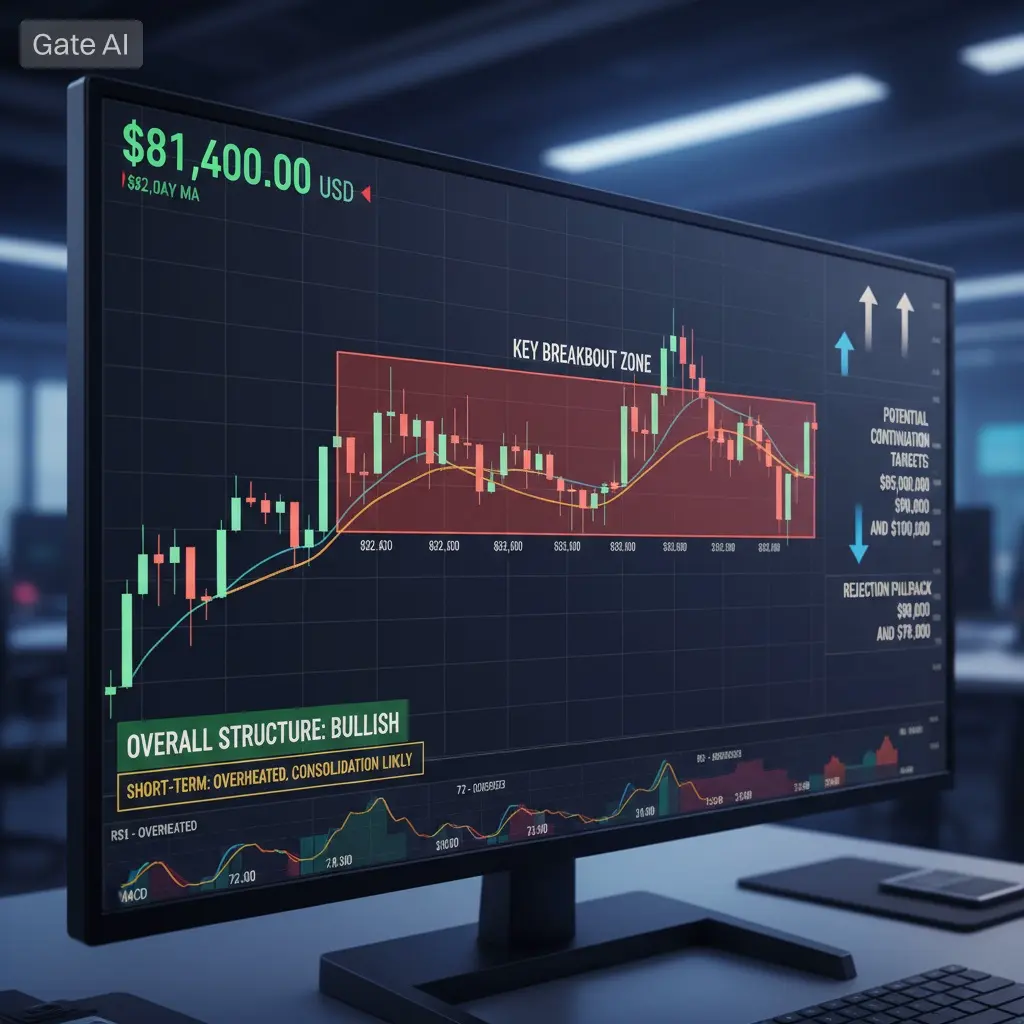
BTC is currently trading around $80,700–$81,000 after reaching intraday highs near $81,200 during recent sessions. This recovery represents:
+14.7% rebound from April lows near $68,000–$70,000
+7%+ rally within recent trading sessions
More than +18% recovery from local panic zones
BTC dominance remaining close to 60%
Daily trading volume exceeding $16B+
The reclaim of $80K is not just another price move — it represents a major shift in: • Market psychology
• Institutional confidence
• ETF-driven demand
• Global liquidity positioning
• Risk appetite across financial markets
• Macro sentiment and speculative positioning
━━━━━━━━━━━━━━━━━━ BITCOIN PRICE STRUCTURE ANALYSIS ━━━━━━━━━━━━━━━━━━
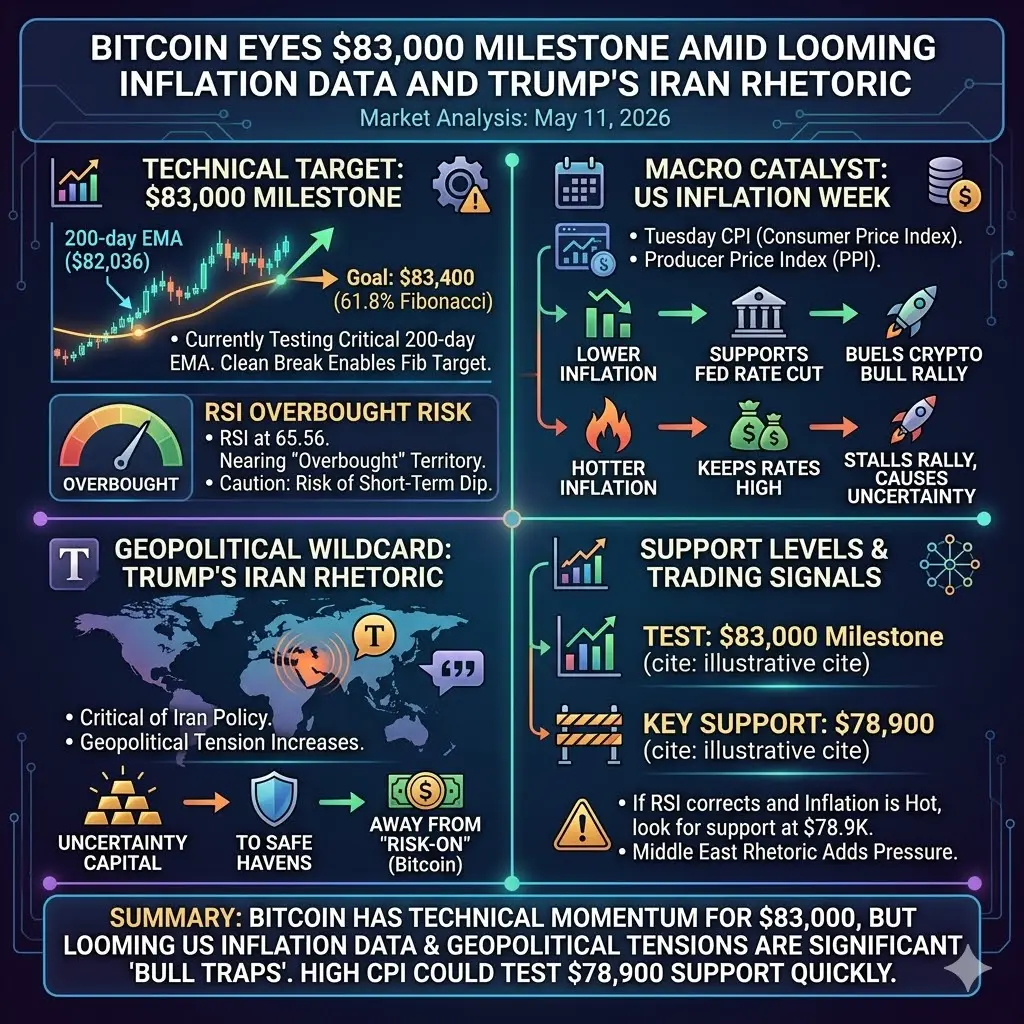
Bitcoin spent several months consolidating below the critical $79K–$80K resistance zone after the sharp correction from the October 2025 ATH above $126K.
The correction pushed BTC through multiple support levels: $110K → $95K → $88K → $82K → eventually $68K–$70K support zones.
This represented approximately: -36% to -46% downside from peak levels depending on entry zones.
Despite the correction: • Long-term bullish structure remained intact
• ETF inflows stayed positive overall
• Institutional exposure continued increasing
• Whale wallets accumulated aggressively during weakness
• Long-term holders showed limited panic selling
The market entered a prolonged accumulation range between: $75K–$79K
Multiple breakout attempts failed initially because of: • Fed uncertainty
• US-Iran conflict fears
• Risk-off positioning in global markets
• Strong USD conditions
• Weak macro liquidity environment
However, early May 2026 completely changed momentum conditions.
━━━━━━━━━━━━━━━━━━ THE BREAKOUT ABOVE $80K ━━━━━━━━━━━━━━━━━━
Bitcoin finally broke above $80,000 during Asian trading sessions around May 4–5.
BTC surged toward: $80,529
then stabilized near: $80,700–$81,000
This breakout was highly important technically because it: • Broke multi-month resistance
• Shifted short-term structure bullish
• Triggered derivatives momentum expansion
• Forced short liquidations
• Increased spot buying activity
• Rebuilt trader confidence
Derivatives data showed: • Taker buy pressure exceeding $1B+ during some sessions
• Funding rates turning positive again
• Open interest expansion across major exchanges
• Increased futures positioning from institutional desks
Volume confirmation significantly strengthened the credibility of the breakout.
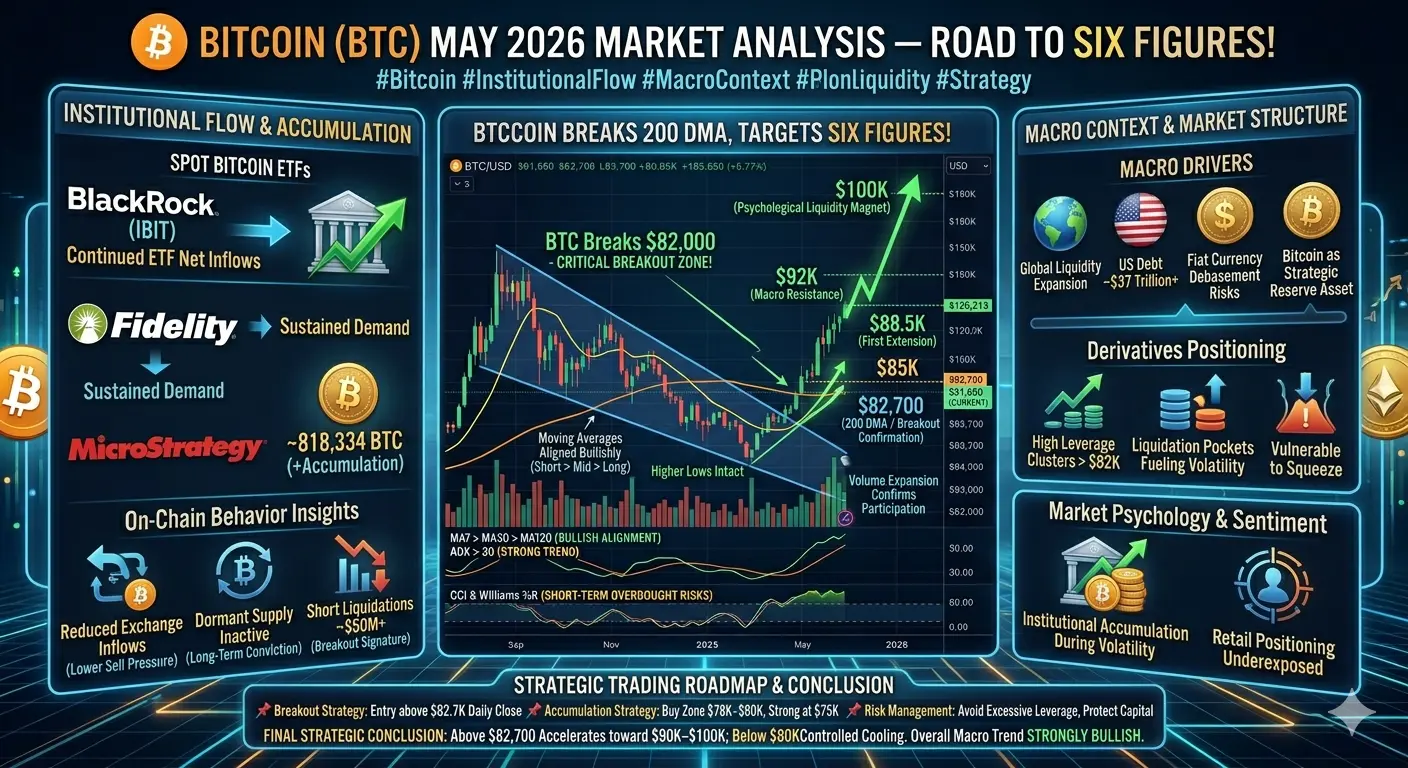
━━━━━━━━━━━━━━━━━━ ETF FLOWS & INSTITUTIONAL DEMAND ━━━━━━━━━━━━━━━━━━
One of the strongest drivers behind Bitcoin’s resilience remains institutional participation.
Spot Bitcoin ETFs continue attracting billions in capital.
Estimated inflows: $2.4B+ during April 2026 alone
Tens of billions cumulative since ETF approvals
Growing hedge fund, pension, and corporate exposure
Institutional investors increasingly treat Bitcoin as: • Digital reserve asset
• Long-term macro hedge
• Inflation-resistant allocation
• Portfolio diversification instrument
• High-growth asymmetric investment
This cycle differs from previous retail-dominated cycles because institutional capital is now providing stronger structural support during corrections.
Large wallet accumulation patterns suggest: Smart money continues buying fear while retail traders remain cautious.
━━━━━━━━━━━━━━━━━━ GLOBAL LIQUIDITY & FED EXPECTATIONS ━━━━━━━━━━━━━━━━━━
Another major bullish catalyst is improving global liquidity expectations.
Markets are increasingly pricing in: • Slower monetary tightening
• Potential Fed stabilization
• Improving liquidity conditions
• Reduced pressure on risk assets
Historically, Bitcoin performs strongly when: • Liquidity expands
• Bond yields weaken
• Risk appetite improves
• Dollar strength slows
This macro shift is beginning to support crypto markets again after months of pressure.
━━━━━━━━━━━━━━━━━━ US-IRAN CONFLICT & GEOPOLITICAL IMPACT ━━━━━━━━━━━━━━━━━━
Geopolitical developments continue heavily influencing crypto volatility.
The ongoing US-Iran conflict has now exceeded 70 days, creating uncertainty around: • Oil markets
• Shipping routes
• Inflation expectations
• Energy supply chains
• Global macro stability
The Strait of Hormuz remains one of the world’s most critical geopolitical pressure points.
Recent developments include: • Partial ceasefire discussions
• Diplomatic mediation through Pakistan & Qatar
• Maritime security operations
• Reduced escalation rhetoric
These developments caused: Brent crude oil to decline nearly 5% during some sessions.
Lower oil prices helped: • Reduce inflation fears
• Improve market sentiment
• Support equities and crypto recovery
• Strengthen Bitcoin’s reclaim above $80K
However, renewed escalation could rapidly increase market volatility again.
━━━━━━━━━━━━━━━━━━ BROADER CRYPTO MARKET CONDITIONS ━━━━━━━━━━━━━━━━━━
The broader crypto market is also improving alongside BTC.
Estimated market conditions: Total crypto market cap near $2.8T
Bitcoin dominance around 60%
ETH trading near $2,300
ETH remains 50%+ below ATH
Daily BTC volume above $16B
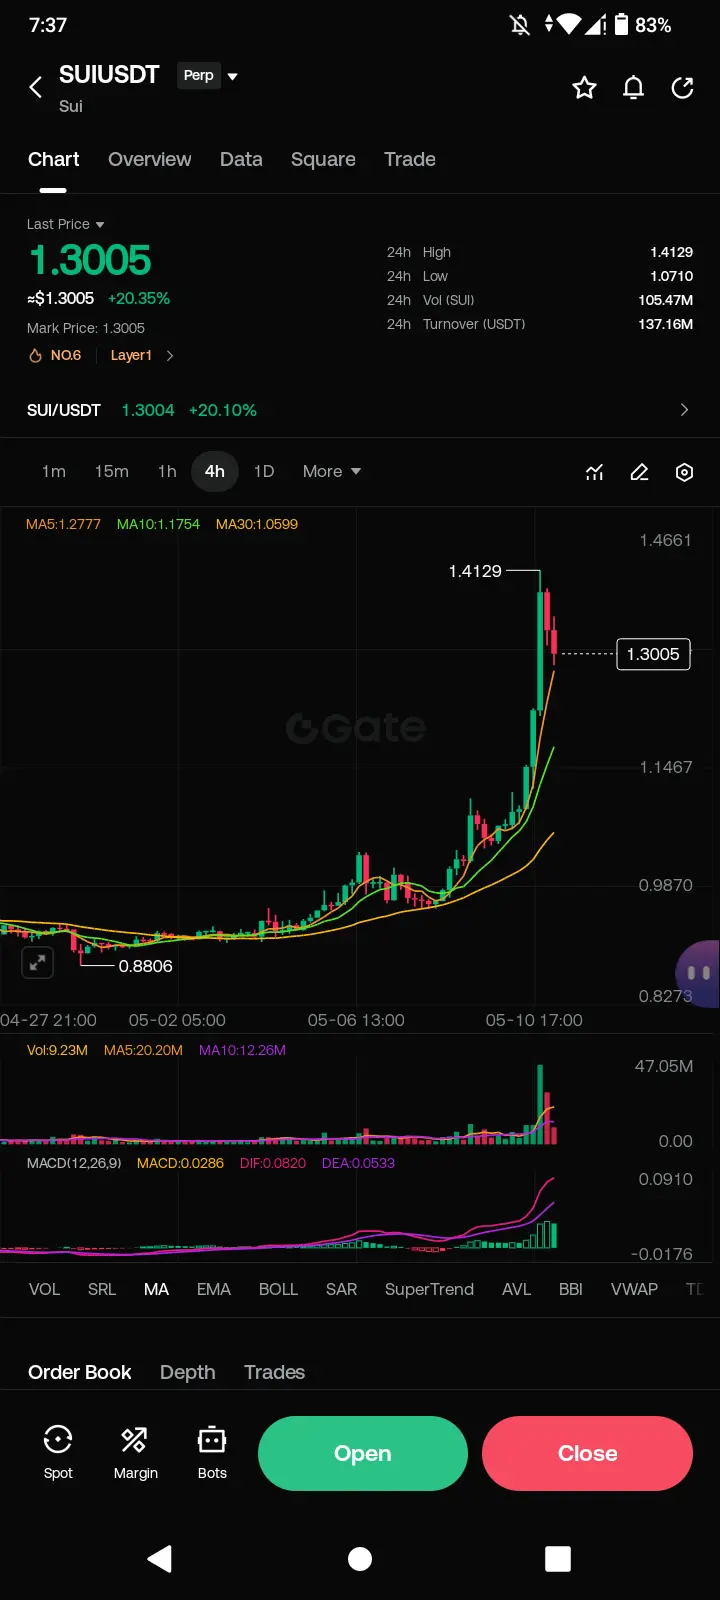
Meanwhile: • Solana ecosystems
• AI-related narratives
• Layer-1 projects
• DeFi sectors
• Mid-cap altcoins
are showing improving momentum and capital inflows.
Capital rotation has started expanding beyond Bitcoin dominance, often signaling: • Early-stage expansion conditions
• Increasing speculative confidence
• Potential broader bull market continuation
━━━━━━━━━━━━━━━━━━ ON-CHAIN DATA & WHALE BEHAVIOR ━━━━━━━━━━━━━━━━━━
On-chain activity also supports bullish arguments.
Current observations: • Exchange BTC reserves declining
• Long-term holders remaining inactive
• Whale accumulation increasing
• Stablecoin liquidity improving
• Reduced panic selling pressure
Lower exchange reserves often create: Supply compression during demand spikes.
At the same time: Retail participation still remains moderate compared to euphoric cycle peaks.
This suggests: The market may still be in a mid-cycle expansion phase rather than near a final top.
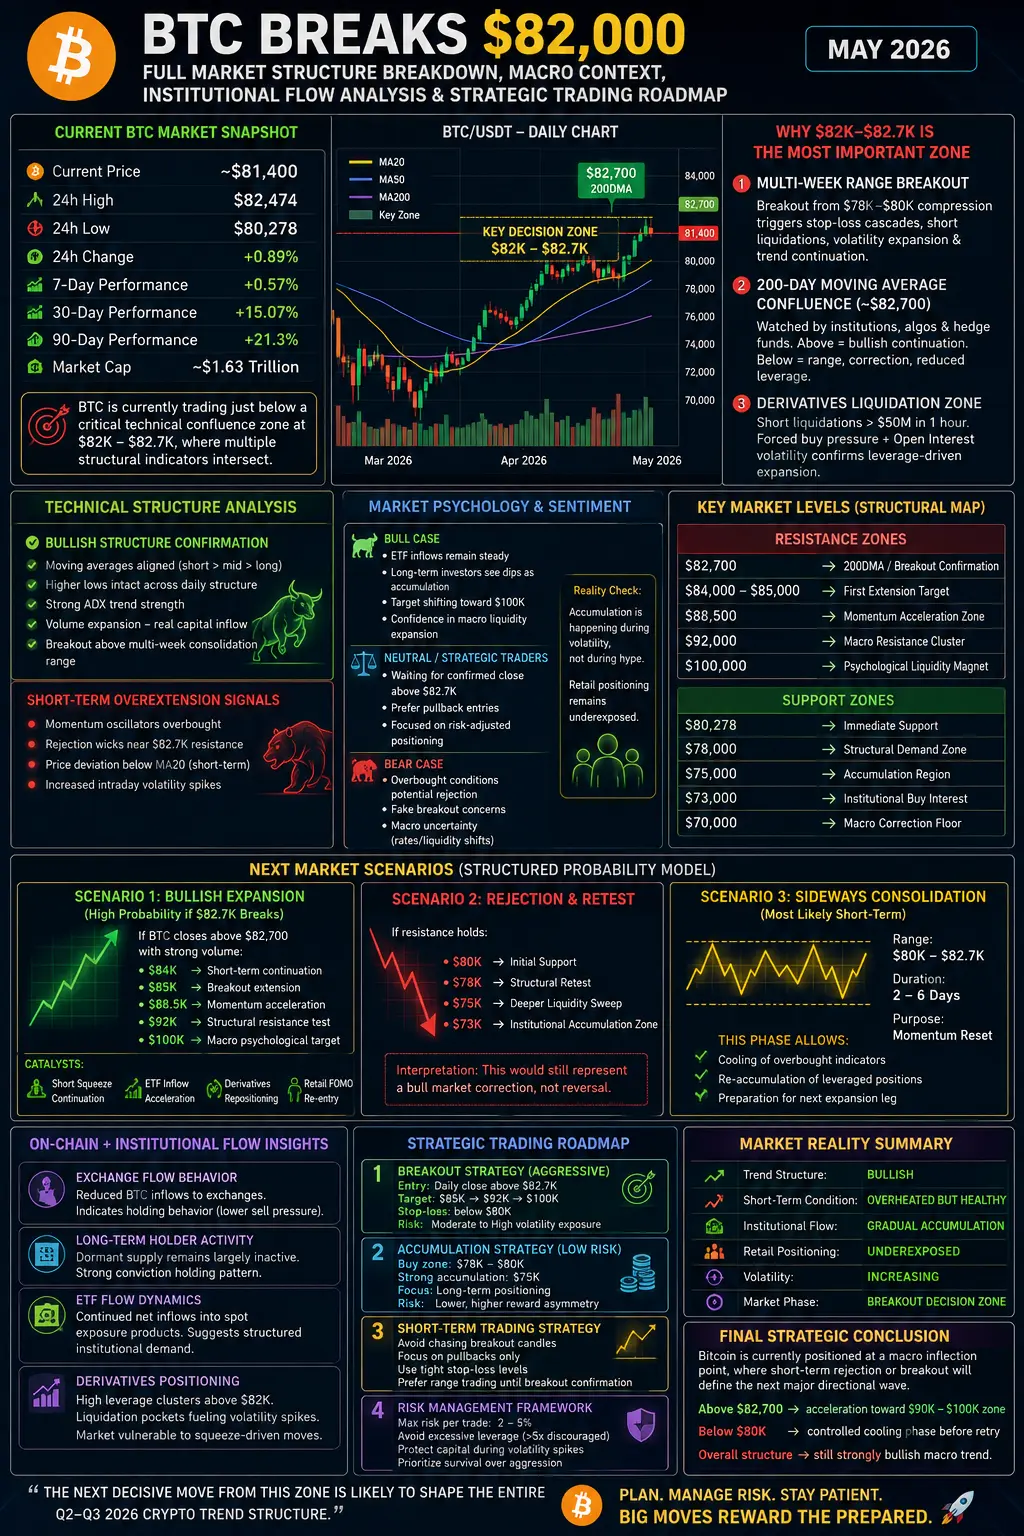
━━━━━━━━━━━━━━━━━━ TECHNICAL STRUCTURE & KEY LEVELS ━━━━━━━━━━━━━━━━━━
Current BTC structure suggests: • Higher lows formation
• Ascending support structure
• Improving RSI and momentum conditions
• Strength above key moving averages
• Bullish short-term market structure
Key Resistance Levels: $81,500
$82,000
$85,000
$90,000
$100,000 psychological zone
Key Support Levels: $80,000
$79,000
$77,000
$75,000
$70,000 macro support
If BTC successfully holds above: $80K–$82K
The probability increases for continuation toward: $85K–$90K
━━━━━━━━━━━━━━━━━━ MARKET PSYCHOLOGY & TRADER SENTIMENT ━━━━━━━━━━━━━━━━━━
The reclaim of $80K has significantly changed trader psychology.
Previous market behavior: • Fear-driven selling
• Distribution concerns
• Defensive positioning
• Panic around macro conditions
Current market behavior: • Recovery optimism
• Re-accumulation activity
• Increased bullish confidence
• Gradual return of speculative positioning
However, volatility remains elevated.
Current market conditions still include: • Liquidity sweeps
• Rapid leverage liquidations
• Emotional overtrading risks
• Macro headline sensitivity
This environment rewards: • Patience
• Structure
• Risk management
rather than emotional decision-making.
━━━━━━━━━━━━━━━━━━ WHAT ARE TRADERS CURRENTLY THINKING? ━━━━━━━━━━━━━━━━━━
Current trader sentiment is divided into three major groups.
Bullish Continuation Traders This group believes Bitcoin completed its correction and is preparing for another expansion phase.
Bullish arguments include: • Strong ETF inflows
• Institutional accumulation
• Improving macro conditions
• Strong support above $80K
• Healthy BTC dominance near 60%
Most bullish traders currently target: $85K → $90K → eventually $100K+
Neutral / Range Traders This group believes BTC may consolidate between: $75K–$85K
before deciding the next macro trend direction.
They focus on: • Volatility trading
• Range opportunities
• Scalping liquidity movements
• Macro headline reactions
Bearish Traders Bearish traders believe: • Macro risks remain dangerous
• Geopolitical tensions could escalate again
• BTC remains below previous ATH
• Profit-taking pressure may increase near resistance
This group expects: Possible rejection near: $82K–$85K
followed by pullbacks toward: $75K–$77K or even $70K.
━━━━━━━━━━━━━━━━━━ TRADING STRATEGY & NEXT PLAN ━━━━━━━━━━━━━━━━━━
Current market conditions favor structured trading over emotional chasing.
Recommended strategy: • Avoid FOMO after large green candles
• Focus on pullback opportunities
• Scale entries gradually
• Monitor volume confirmation carefully
• Take partial profits near resistance zones
• Avoid excessive leverage
Key Entry Zones: Aggressive dip entries: $79,500–$80,000
Strong accumulation zones: $77,000–$78,000
Deep correction opportunity: $70,000–$75,000
Breakout confirmation entries: Above $82,000 with strong volume.
━━━━━━━━━━━━━━━━━━ UPSIDE POTENTIAL & PRICE TARGETS ━━━━━━━━━━━━━━━━━━
If BTC successfully maintains support above $80K:
Short-term targets: $82K
$85K
$88K–$90K
Medium-term targets: $100K
$110K
$120K
Long-term bullish scenarios: $130K–$150K possible during 2026 if: • ETF inflows continue accelerating
• Global liquidity improves further
• Fed pressure weakens
• Institutional adoption expands globally
Extreme bullish scenarios discussed by some analysts: $180K+
Potential upside from current levels near $81K: +11% to $90K
+23–25% to $100K
+48% to $120K
+85% to $150K
━━━━━━━━━━━━━━━━━━ DOWNSIDE RISKS ━━━━━━━━━━━━━━━━━━
Despite bullish recovery, several risks remain important.
Potential bearish catalysts: • Renewed geopolitical escalation
• Fed tightening surprises
• Inflation rebound
• ETF outflows
• Large-scale profit-taking
• Strong USD recovery
Potential downside scenarios: Below $79K → retest $75K–$77K
Below $75K → possible move toward $70K
Extreme panic → deeper liquidity sweep conditions
However, structural demand currently appears stronger than during previous cycles.
━━━━━━━━━━━━━━━━━━ SMART MONEY VS RETAIL BEHAVIOR ━━━━━━━━━━━━━━━━━━
One important observation: Institutional investors and whales appear significantly calmer than retail traders.
Current smart money behavior suggests: • Strategic accumulation during fear
• Reduced emotional selling
• Long-term positioning
• Controlled exposure management
Meanwhile, retail traders continue: • Overtrading volatility
• Chasing momentum emotionally
• Using excessive leverage
• Reacting heavily to headlines
Historically: Markets reward patience and discipline more than emotional aggression.
━━━━━━━━━━━━━━━━━━ FINAL OUTLOOK ━━━━━━━━━━━━━━━━━━
Bitcoin reclaiming $80,000 represents far more than a simple technical breakout.
It signals: • Renewed institutional confidence
• Improving macro conditions
• Stronger liquidity flows
• Continued ETF demand
• Recovery in market sentiment
• Rebuilding bullish momentum
The market is transitioning from defensive consolidation toward constructive bullish expansion.
The next major battle zones remain: $82K
$85K
$90K
If Bitcoin successfully establishes support above these regions, the path toward: $100K–$120K+ becomes increasingly realistic during the broader 2026 cycle.
For now: $80,000 is no longer acting as resistance — it is beginning to act as a new structural floor for Bitcoin.
#GateSquareMayTradingShare: #GateSquare #ContentMining #CreatorCarnival